I was thinking of the desire for "dabbling" the other day.
You only need to know a little bit, to be ok doing that.
Even when there are mo l;arge swings in the markey going on which you can join in with.
The way the prices move is highly repetitive, in a lot of different "modes". You have to recognise which mode is useful at a particular time.
Imagine a huge sheet of metal dangled by one corner. People whack it with hammers from time to time, then it rings and vibrates and swings at all sorts of frequencies which come snd go without anyone doing anything.
The markets is largely controlled by "bots".
A price goes up. That's attractive for making money so the bots invest, which pushes the price higher. Then the bots' algorithms tell it that the price s high enough so it sells. So the price falls. That's not just an "out of the market" sell, it's what's called a "short", a position which profits when the price goes down.
[Think that you borrow a share when its price is £100 and sell it for £100. The if the price drops, you replace the share, when the price is £90. You made a tenner.]
So without any exterior influence, the prices go up and down. They do it in "ranges" or "channels" say between £100 and 110. If the "spread" (the buy-sell price difference) is £1, then once you've sussed the pattern, you can buy (going "long") and/or sell atthe appropriate times to make, say £7 a time, allowing a margin. Often you can win on 3 or 4 rises and falls before the pattern changes and you cut it short. So you might win £25 then lose £5. If the pattern changes and you're ready for it, you do better.
Prices do not go in ranges all day. One tactic is to watch several charts (shares/funds/indices etc) at once until you find one which is doing it, and use that. They're common towards the end of the day when there hasn't been any particular news.
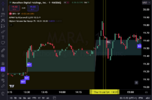
Here's one I used the other day:
You can see the price was in a slowly rising channel
The bottoms were about 172.40. I picked it up at the dip at 17:30.(time axis).
I watched for the wicks becoming the same height, where the bottom of the "L" of "GOOGL" is.
You get used to picking the tops and bottoms, from the wick extremes. Though sometimes they catch you out a bit.
The next peak wasn't as high, but showed the same topping appearance, so fine, I got out there.
The bottoms were easy to spottoo, see? The price jumps about so you hit the button best you can.
The next peak stopped half way up, so I held, ready to get out if the price dropped but it went on up.
There were two tallgreen candles which suggetsed a reverse (same as the ones above the "00" of 17:00 so I sold.
Two minutes later it was clear the price was going on up so I bought again until it got to here.
What do you think is going to happen next?
The price has curled over again, looks like it's going flat, see? So I sold.
(You get the "bid" price, here 173.66. If you bought atthis point you'd pay 173.70, the difference is the spread

The next couple of cndles went a little higher, but where I sold was fine.
That wiggly red line is an "indicator" where things can change, so I didn't get involved until it made a new recognizable pattern.
If you look at the prices you can see that if you owned one share you wouldn't make much. I checked, it was $2.43 of share price over the whole period with some "longs" and some "shorts".
You don't use that little, when you're not learning any more (when learning use $0, in a simulator).
Ifyou used say $1000 in a pot, in a platform where you can routinely leverage at 5x, you're effectively using $5000.
One way to work that out is 5000/173 = 29 shares so you'd make 29 x £2.43 = $70 approx.
If you used $10k you'd have made $700, $100k would have made $7000, etc.
To improve your chances of NOT getting caught, wait until the direction you want is established (by one candle, say). That reduces your profit per swing, ok.
To improve your chances more, you look for the TREND, which here is slightly UP. Then you ONLY use the rising parts of the wave. The advantage there is that if you cock it up for some reason or there's a twitch, you can usually just WAIT, and the price will come up for you.
That simple ploy would usually see you OK.
Here's an up-channel over a much longer period (everything's "fractal" - same patterns over all periods)
Persimmon since STarmer. WIth this sort of thing if you get out when theres a red and buy again when there's a couple of greens, it works nearly all the time. It was only half a dozen interactions but a lot of watching. The channel lines are not meant to be particularly accurate, but you can see they're narrowing. It will peak very soon if it hasn't already. I've sold most of mine late Friday, expecting a dip then dunno on Monday.
NB this gave near 20% . If you use leverage of 5x that means you doubled your money, but less a bit due to overnight fees, perhaps 2% off the 100%.
If you double your money every month, a 20k investment becomes 4096x =~ 82M in a year.
You don't always get it right.


